Determination of non-sugar sweetener intake in adults with Type 1 Diabetes mellitus in Chile
Verónica Sambra V1,6, Stefania Castillo2, Tomás Guzmán2, Javiera Collinao2, Alexandra Espinoza2, Krystof Bobenrieth3, Sabrina Valenzuela2, Lissette Duarte S1,4,5*.
Determinación de la ingesta de edulcorantes no azucarados en adultos con diabetes mellitus tipo 1 en Chile
- Department of Nutrition. Faculty of Medicine. University of Chile. Santiago, Chile.
- Student. School of Nutrition and Dietetics. Faculty of Medicine. University of Chile. Santiago, Chile.
- Student. School of Medicine. Faculty of Medicine. University of Chile.Santiago, Chile.
- Santa Maria Clinic. Santiago, Chile.
- PhD, Nutritionist from the University of Chile. Santiago, Chile.
- Msc, Nutritionist University of Chile. Santiago, Chile.
*Correspondence: Lissette Duarte S. / lissette.duarte@uchile.cl.Department of
Nutrition. Faculty of Medicine. University of Chile.
Independencia 1027. Santiago, Chile.
Source of financial support: Financing. Chilean Society of Endocrinology and Diabetes, SOCHED Project N° 2019-04, “Effect of intake a breakfast with and without sweeteners (stevia and sucralose) on the postprandial glycemic response and the sensation of appetite – satiety, in subjects with type1: controlled clinical trial” (Code of approval of the Ethics Committee of the Faculty of Medicine of the University of Chile: 147-2019, minutes No. 150).
Conflict of interest: The authors do not declare a conflict of interest.
Received: 30-07-2024.
Accepted: 02-09-2024.
Abstract: Introduction: Type 1 diabetes mellitus (T1D) treatment aims for glycemic
control through insulin therapy, carbohydrate intake, and physical activity. Non-sugar
sweeteners (NSS) are used to reduce sugar consumption and weight control. It is
unlikely that children with type 1 diabetes exceed the acceptable daily intake (ADI)
for different NSS, but it is not known what happens to the NSS intake of adults with
T1D in Chile. Objective: To estimate the consumption of non-sugar sweeteners
(NSS), considering the proportion of users, the intake level relative to the ADI, and
the differences in intake according to sex in a sample of adults with T1D in Chile.
Methods: In this descriptive study, 32 adults diagnosed with T1D were recruited. NSS
consumption was assessed via a Food Frequency Questionnaire. Statistical analysis
included t-tests, Mann-Whitney U, and Fisher’s exact tests. Results: All individuals
consumed NSS. Sucralose, steviol glycosides, acesulfame K, and aspartame were
NSS most frequently consumed. Although the average daily NSS intake was 241.4
mg, within acceptable limits. Steviol glycosides had the highest percentage of acceptable
daily intake (9.9%). Beverages were the primary sources of NSS, contributing
91% of acesulfame K, 86% of aspartame, and 29% of sucralose consumed during
the day. High NSS consumers had a higher obesity proportion, while low consumers
had more overweight individuals. Conclusions: This study reveals widespread NSS
consumption in adults with T1D, emphasizing the need for continued research and
monitoring to understand the long-term implications of NSS use in this population.
Keywords: Acceptable daily intake; Acesulfame K; Aspartame; Non-sugar sweeteners;
Steviol glycosides; Type 1 diabetes mellitus.
Resumen: Introducción: El tratamiento de la diabetes mellitus tipo 1 (DM1) busca
el control glucémico a través de la terapia con insulina, la ingesta de carbohidratos
y la actividad física. Los edulcorantes no azucarados (ENA) se utilizan para reducir
el consumo de azúcar y el control del peso corporal. Hay pocas posibilidades
de que los niños con diabetes tipo 1 excedan la ingesta diaria aceptable (IDA)
de los diferentes ENA, pero no se sabe que ocurre con la ingesta de ENA de los
adultos con DM1 en Chile. Objetivo: Estimar el consumo de ENA, considerando
la proporción de usuarios, el nivel de ingesta relativo a la IDA y las diferencias en
la ingesta según el sexo en una muestra de adultos con DM1 en Chile. Métodos:
En este estudio descriptivo se reclutaron 32 adultos diagnosticados con DM1. El consumo de ENA se evaluó mediante un Cuestionario de Frecuencia Alimentaria.
El análisis estadístico incluyó pruebas t, U de Mann-Whitney y exacta de Fisher.
Resultados: Todos los individuos consumieron ENA. Sucralosa, glucósidos de esteviol,
acesulfame K y aspartame fueron los ENA más frecuentemente consumidos.
Aunque la ingesta diaria promedio de ENA fue de 241.4 mg, se mantuvo dentro de
los límites aceptables. Los glucósidos de esteviol presentaron el mayor porcentaje
de ingesta diaria aceptable (9.9%). Las bebidas fueron las principales fuentes de
ENA, contribuyendo con el 91% del acesulfame K, el 86% del aspartame y el 29%
de la sucralosa consumidos durante el día. Los altos consumidores de ENA presentaban
una mayor proporción de obesidad, mientras que los bajos consumidores
tenían más individuos con sobrepeso.Conclusiones: Este estudio revela un consumo
generalizado de ENA en individuos adultos con DM1, enfatizando la necesidad de
continuar la investigación y la monitorización para comprender las implicaciones a
largo plazo del uso de ENA en esta población.
Palabras clave: Acesulfamo K; Aspartamo; Diabetes mellitus tipo 1; Edulcorantes
no azucarados; Glucósidos de esteviol; Ingesta diaria aceptable; Sucralosa.
Introduction
Type 1 diabetes mellitus (T1D) is caused by destruction of beta cells in the pancreas, leading to an absolute insulin deficiency1. It is primarily diagnosed in children and adolescents but can occur in any age group1. The International Diabetes Federation (IDF) estimates that around the world, 537 million adults live with diabetes, of which 32 million are in South and Central America2. In Chile, according to the latest national health survey (2016-2017), the prevalence of people with suspected diabetes was 12.3%3. In addition, a recent study indicated that the incidence of T1D in the Chilean population under 20 years of age increased from 9.18 per 100,000 inhabitants in 2010 to 13.3 per 100,000 inhabitants in 20194.
Treating people with T1D aims to maintain glycemic levels within adequate ranges, which requires management through insulin therapy, adequate carbohydrate intake (CHO), and physical activity5. One of the strategies currently used to reduce sugar consumption has been the incorporation of non-sugar sweeteners (NSS), which confer an increase in sweetness without providing calories or CHO6. Indeed, the ADA (American Diabetes Association) states that the use of NSS may have the potential to reduce calorie and CHO intake if caloric sweeteners (sugar) are substituted for NSS and are not offset by additional calorie intake from other food sources7. The Chilean Food Sanitary Regulation (RSA) has authorized its use only in foods for weight control regimes, free, low, or reduced in sugars, calories, and fat8. In addition, the RSA establishes acesulfame potassium, aspartame, cyclamic acid, and saccharin (its sodium, potassium, and calcium salts), sucralose, alitame, neotame, and steviol glycosides as NSS. Following the implementation of the Nutrition Labeling Law in Chile in 2016, the food industry incorporated more NSS to avoid the “high sugars” label9. This resulted in several products that should have been labeled as “high in sugars” being reformulated, including NSS, to maintain the sweetness of foods10,11.
A recent review reported that in Latin America, 70% of people are consumers of products with NSS, with Chile being one of the countries with the highest consumption12. This phenomenon could represent an emerging problem due to the large amount of NSS-containing foods available in the Chilean market and the possible implications at the metabolic level derived from high exposure to NSS13.
On the other hand, the World Health Organization (WHO) recently advised against using NSS for weight management and preventing non-communicable diseases, although this advice is based on studies that focus on NSS consumption ADI and exclude individuals with pre-existing diabetes14.
Current studies investigating whether NSS intake exceeds the ADI in different populations show conflicting results15,16,17. In this regard, some studies in other countries suggest that T1D people do not exceed the ADI of NSS. In particular, it has been reported that the 97.5th percentile of intakes usually remains between 2% and 4% of the ADI in the T1D population18,19. In contrast, children with T1D have been shown to exceed the ADI for acesulfame-K, cyclamate, and steviol glycosides among consumers with higher exposure to NSS through their diet19. Additionally, a study in a Chilean population showed that 25% of children with T1D and 5.2% of adults with Type 2 diabetes mellitus (T2D) exceeded the ADI for saccharin. Still, no data were reported for the adult population with T1D20.
Considering that in Chile, no studies examine the consumption of NSS in the adult population with T1D, and taking into account that the consumption of NSS is growing at a constant rate, this study aims to estimate the consumption of NSS, considering the proportion of users, the intake level relative to the ADI, and the differences in intake according to sex in a sample of adults with T1D in Chile.
Subjects and methods
This study evaluated 32 adult subjects with T1D: 13 individuals using an intensified regimen (multiple insulin injections) and 19 individuals using an insulin pump were studied. Recruitment took place through social media channels and interpersonal networks associated with the university facilities of the University of Chile in Santiago, Chile. This study received approval from the Faculty of Medicine Ethics Committee at the University of Chile (approval code project 147-2019, file N°150). All subjects provided signed informed consent before entering the study, during which they were briefed on the research’s purpose, the voluntary nature of participation, and the confidentiality of their data.
Determination of Nutritional Status
Body weight was recorded using a SECA® model 767 digital scale (precision of 0.1 kg), and height was measured with a stadiometer attached to the scale (precision of 0.1 cm). Measurements were taken with subjects barefoot, weight evenly distributed, and in light clothing. The obtained data were used to calculate the body mass index (BMI= weight (kg)/height (m^2)) using standardized methods21.
Consumption of non-sugar sweeteners
Detailed estimation of exposure to food additives, including NSS, was obtained by collecting and analyzing qualitative and quantitative data. A Food Frequency Questionnaire (FFQ) was conducted, where individuals were prompted to recall their intake over one month. This survey gathered the dietary patterns of specific foods consumed by the individuals. It enabled the assessment of the frequency of consumption, focusing on foods containing added NSS and discretionary sweetener intake. The qualitative and quantitative composition of food additives and NSS was determined using a database published in a previous study11 with updated data after the final implementation of the nutritional labeling law in Chile. This methodology allowed the assessment of the consumption of the following food additives and NSS, which are approved in the food health regulation in Chile, regulated in article 14622. In addition to the regulation, the food additive d-tagatose was considered.
Food Sampling:
A sample set containing photos of 815 foods containing NSS available in the Chilean market was used. This set is categorized by food groups to facilitate quick identification11.
Survey FFQ Administration:
Conducted by a nutritionist, and data entry was performed by trained personnel affiliated with the University of Chile. The FFQ data was collected through in-person interviews. A visual guide comprising a comprehensive photographic atlas categorizing NSS-containing products into various food groups was presented to the individuals. They were then asked to specify their typical frequency of consuming each item. Subsequently, individuals provided information on serving sizes using household units of measurement. The daily intake of each NSS was computed as follows: Daily NSS Intake (mg/ day)= [Number of daily servings × Monthly frequency of intake × Serving size (g or mL) × Concentration of each NSS in the food matrix (mg/100 g)] / 30. The daily intake per kilogram of body weight for each NSS was determined by dividing the previously calculated daily intake by the body weight (mg/kg bw).
Permissible Daily Intake of NSS Analyzed
The ADI for each patient was calculated based on the ranges established by the RSA for each NSS, always using the upper limit of each range. The percentage of ADI covered by each NSS was determined by dividing the actual daily intake by the calculated ADI multiplied by 100. The ranges used were: Sucralose: 15 mg/kg, Saccharin: 5 mg/kg, Acesulfame K: 15 mg/kg, Cyclamate: 7 mg/kg, Stevia: 4 mg/kg, Aspartame: 40 mg/kg22,23.
Statistical Analysis
The statistical analyses were conducted using SPSS version 20 (IBM SPSS Statistics, USA). Data normality was assessed using the Shapiro-Wilk test. Continuous variables are presented as mean ± SD; however, since it was determined that some constant variables did not follow a normal distribution, they are reported as medians and percentiles 25-75, while categorical variables are expressed as frequencies and percentages. We described the daily intake of NSS (mg/day) and the daily NSS intake per kilogram of body weight per consumer, comparing them with the ADI of NSS defined by the European Food Safety Authority (EFSA).
General characteristics, NSS daily consumption (mg/d), and
percentage of ADI of NSS were evaluated by sex category
and compared using the Student’s t-test for independent
samples or Mann-Whitney U. For each NSS, participants were
categorized into two groups: low consumers and high consumers
(Categories of consumption were defined as lower consumers,
and higher consumers separated by the sex-specific median
among consumers of 280.35 mg/day in men and 222.75 mg/
day in women). This criterion was used since it was the same
one applied by Debras, et al24. Nutritional status classification
was assessed for the overall population and by category of
total NSS intake, and for each specific NSS, comparisons were
made using Fisher’s exact test (χ2) for categorical variables,
respectively. A 0.05 (two-tailed) significance level was considered
statistically significant for all analyses.
Results
Thirty-two individuals participated in this study, of which 56.3% were women and 43.7% were men. The sociodemographic characteristics of the individuals are shown in Table 1. 50% had a normal nutritional status, 28.1% were overweight, and 21.8% were obese. No significant differences were observed between the groups regarding age, BMI, HbA1c (%), HbA1c mmol/l, and years since the onset of diabetes. However, differences were noted in weight and height. 75% of the subjects had an HbA1c within the therapeutic goal, and only 25% had an HbA1c above 7.5%.
Regarding the individual and total daily consumption of at least one food with NSS (Table 2), it was observed that all subjects (100%) consumed at least one food with NSS. Ingestion of saccharin and cyclamate was not reported. 100% of the individuals consumed steviol glycosides, and 96.8% consumed sucralose. Women consumed 1.5 times more steviol glycosides than men, and men consumed 1.3 times more aspartame than women. In total, subjects consumed 241.4 mg/d of NSS. There were no significant differences between men and women in terms of daily consumption of each NSS (Table 2).
Table 3 illustrates the percentage of acceptable daily intake for each NSS. Steviol glycosides showed the highest rate, with an overall median of 9.9%, indicating that individuals achieved approximately 10% of the ADI for this specific NSS. Although none of the subjects studied exceeded the ADI for any of the NSS, the maximum percentage of ADI reached for stevia was 67.9%, 25.8% for acesulfame K, 17.7% for sucralose, and 13.1% for aspartame.
The contribution of each NSS to the total intake of individuals with T1D is seen in Figure 1, where 41% of NSS intake came from aspartame, followed by 25% from acesulfame K, 21% from sucralose, and 13% from steviol glycosides. Regarding the primary food sources responsible for the consumption of each NSS represented in Figure 2, we observed that beverages were the main contributors to the consumption of aspartame, acesulfame K, and sucralose and represented 91%, 86%, and 29% of the intake of acesulfame K, aspartame and sucralose, respectively. Sucralose intake came mainly from beverages, dairy products, and cereals, representing 29%, 22%, and 22% of the total sucralose consumed from food. Furthermore, dairy products were the main contributors to the consumption of steviol glycosides, providing 36% of this NSS. Sweeteners and candy/desserts were the second and third contributors to the consumption of steviol glycosides, contributing 23% and 20%, respectively. NSS comes in granules, tablets, or liquid form; 90.6% (n= 29) of the 32 participants consume them, of which 62.5% (n= 20) consume 2 different ones. 66.6% is in liquid form, highlighting the intake of liquid sucralose and stevia in 87.5% (n= 28) of individuals with T1D. Finally, both NSS low and high consumers exhibit an equivalent number of individuals with a normal nutritional status. Nevertheless, when compared to low consumers, those with high consumption display a greater proportion of individuals classified as obese according to BMI, whereas low consumers show a higher proportion of individuals classified as overweight, as depicted in Figure 3.
Table 1. Sociodemographic characteristics.
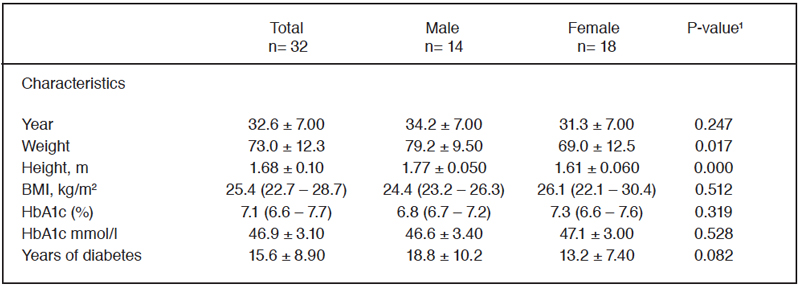
Data are expressed as means ± SD or as median (25th-75th percentile) values. ¹Data were analyzed using the Student’s t-test or Mann-Whitney U. *Significant main effect of sex, p<0.05.
Table 2. NSS daily consumption (mg/d) by sex.
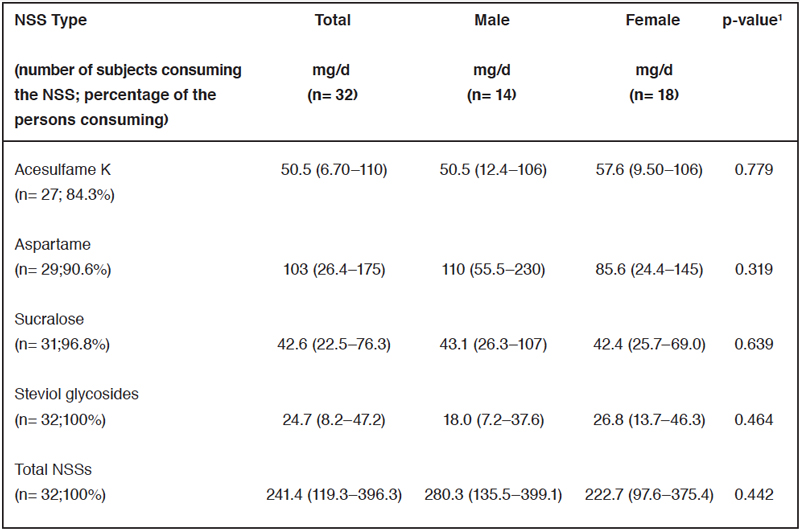
Values are n (%) unless stated otherwise. The median and 25th and 75th percentiles are based on consumers1. Data were analyzed using the Mann-Whitney U test. *Significant main effect of sex, p<0.05.
Table 3. Percentage of ADI for each NSS by sex.
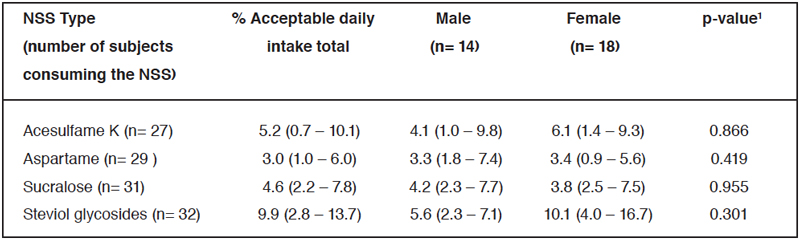
The median and 25th and 75th percentiles for % acceptable daily intake. ¹Data were analyzed using the Mann-Whitney U test. *Significant main effect of sex, p<0.05.
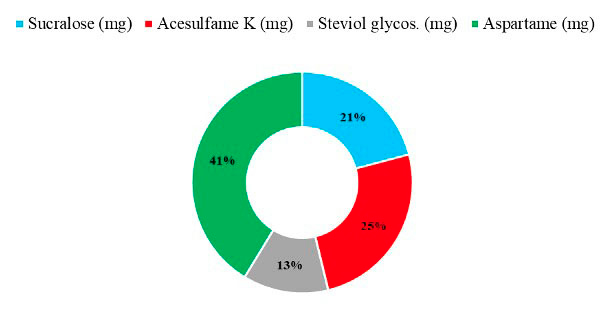 Figure 1: Contribution of each NSS to total intake.
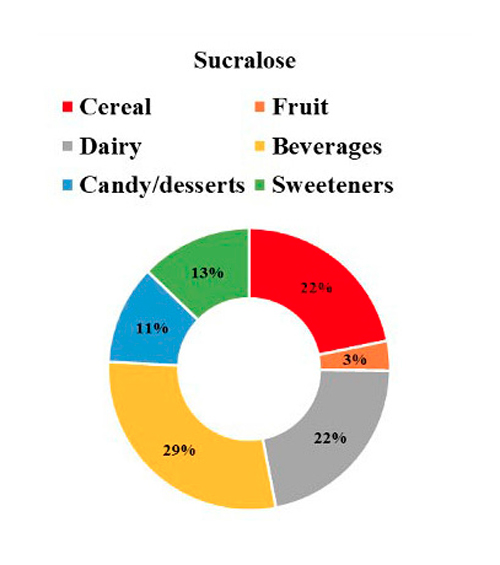
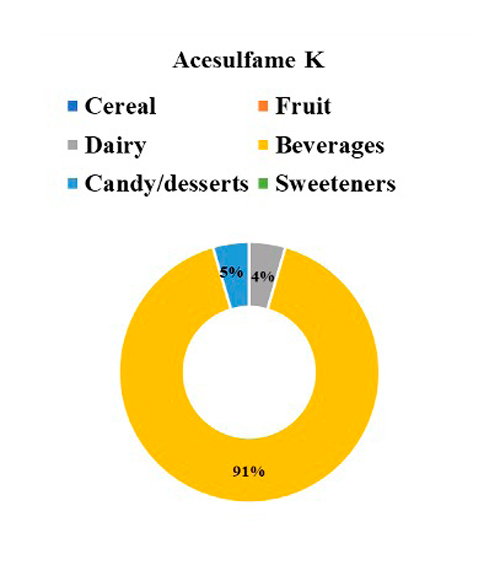
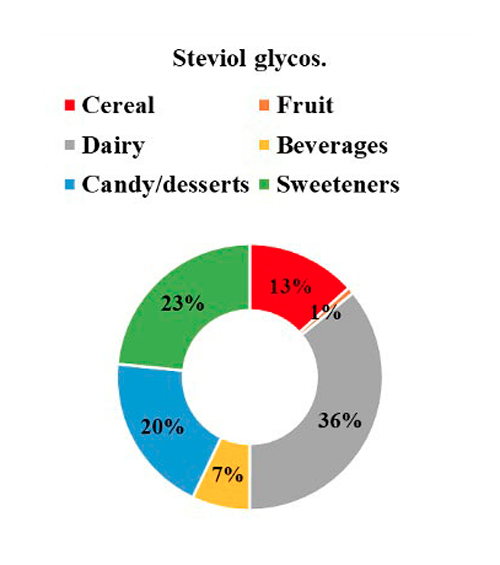
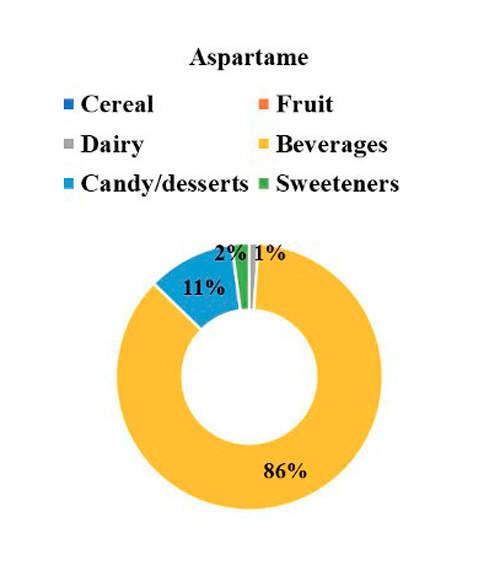
Figure 2: NSS intake by food categories.
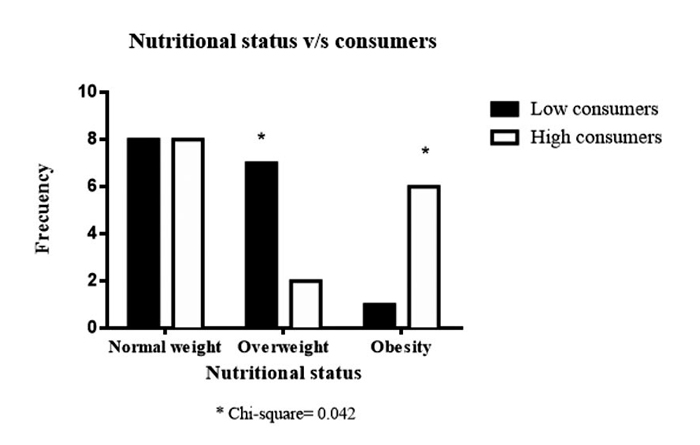 Figure 3: Low consumers and high consumers NSS by Nutritional status
classification. Fisher’s exact test (χ2).
Figure 3: Low consumers and high consumers NSS by Nutritional status
classification. Fisher’s exact test (χ2).
Discussion
Our research revealed that there are no differences between sexes in consumers of NSS. One hundred percent of the individuals consumed at least one food with NSS. A previous study carried out in 2013 in the Chilean population described that 85% of adults and 75% of children consumed a product with NSS20. This study also evaluated the consumption of NSS in people with diabetes. It concluded that 98% of them consumed products with NSS and that their intakes were significantly higher than those of adults and children without diabetes. Furthermore, it was found that 5.2% of adults with TD2 and 25% of children with T1D were above ADI for saccharin20. Contrary to this, our study revealed that individuals did not exceed the ADI for any NSS examined, with aspartame being the most consumed. Regarding total NSS consumption, in our research, the sex-specific medians were 280.3 mg/day in men and 222.7 mg/day in women, respectively. This far exceeds the levels reported by Debras, et al.24 25 in individuals without diabetes, where the sex-specific mean NSS intake was observed to be 16.4 mg/day in men and 18.5 mg/day in women. Furthermore, in our study, the “NSS high consumers” exhibit a higher percentage of individuals with obesity, whereas those “NSS low consumers” display a greater proportion of individuals categorized as overweight. This is consistent with a review concluding that in prospective cohort studies, lowcalorie sweetener intake was not associated with body weight or fat mass but was significantly associated with slightly higher BMI (0.03; CI 95%: 0.01, 0.06)25.
On the other hand, a study where a cross-sectional survey was conducted in a clinical cohort of 532 adults with T1D, showed that 99% of individuals had heard of NSS, 90% had used it before and 68% had used NSS in the last month. Regarding food sources, NSS came mainly from beverages (95%). Furthermore, aspartame was reported to be the most commonly used (41%), followed by stevia (31%), sucralose (17%) and saccharin (8%)26. In our sample, aspartame led the consumption at 41%, followed by acesulfame K at 25%, sucralose at 21%, and steviol glycosides at 13%. Additionally, adults with T1D in our study reported no consumption of saccharin or cyclamate. This is important considering that the only Chilean study previously published on individuals with diabetes indicated that only with saccharin did a percentage of children with T1D and adults with T2D exceed the ADI20. But it can be explained because today there is a tendency to replace cyclamate and saccharin with other NSS such as sucralose, aspartame, acesulfame-l, and stevia since previous studies in animals have revealed that the consumption of saccharin and cyclamate is associated with an increased risk of bladder cancer27.
Regarding the intake of NSS from tabletop sweetener (TTS), in our study, the most common intake was liquid sucralose and stevia forms in 87.5% of participants with T1D, and our survey discriminated between powder, tablet, and liquid forms. However, estimating the intake of NSS from TTS products is challenging, because many TTS products contain multiple types of NSS, and their formulas can vary significantly28,29.
It is noteworthy that the majority (75%) of individuals with T1D studied had HbA1c values below 7.5% (58 mmol/mol). The American Diabetes Association (ADA) states that for this population an HbA1C <7% is considered adequate30. Although the T1D adults studied had a relatively adequate HbA1c, a Cochrane review states that there is no conclusive evidence regarding the effects of NSS consumption compared to sugar, placebo or low-calorie nutritive sweeteners on clinically relevant benefits or harms for HbA1c in people with T1D31.
Finally, this study provides valuable insights but faces several limitations that can affect the external validity. These include selection bias due to a non-representative sample, potential dietary data inaccuracies due to being based on people’s recollections, and product formulation variability. Despite this, we implemented a valid method to collect dietary data, such as food frequency questionnaires, to minimize the biases and issues identified in the study. We employ trained dietitians to assist participants in accurately recording their intake. We also worked closely with food manufacturers and visited supermarkets to obtain detailed information on products containing NSS.
Conclusion
In conclusion, our study with 32 individuals diagnosed with T1D revealed universal NSS consumption, with sucralose, steviol glycosides, acesulfame K, and aspartame being the most prevalent choices. Also, no significant differences in total daily NSS intake were found between men and women, indicating sex-neutral consumption behavior. The average NSS consumption in the individuals studied was 241.4 mg/day, with no individuals exceeding the ADI for any NSS, suggesting safe consumption levels. Beverages were identified as the primary source of NSS intake, followed by dairy products and cereals. This study also notes a shift from cyclamate and saccharin to other NSSs like sucralose and stevia, reflecting changing consumption trends. Although our study provides some essential data on NSS consumption patterns among individuals with T1D, further follow-up is needed to understand the long-term implications of NSS use in this population. Additionally, to enhance the validity and reliability of future research, it is essential to employ strategies to improve sample representation, control for confounding factors, and reduce reliance on memory.
References
- American Diabetes Association Professional Practice Committee; 2. Diagnosis and Classification of Diabetes: Standards of Care in Diabetes-2024. Diabetes Care 1 January. 2024; 47(Suppl1): S20-S42.
- International Diabetes Federation. IDF diabetes atlas 10 th edition. 2021; Disponible en: https://diabetesatlas.org/data/en/
- Ministry of Health. National Health Survey 2016-2017: First results. 2017. https://www.minsal.cl/wp-content/uploads/2017/11/ENS-2016-17_PRIMEROSRESULTADOS. pdf
- Zepeda D, Arriaza M. Incidence of type 1 diabetes mellitus in the population under 20 years of age in the last decade in Chile. Rev. Chil. Endocrinol. Diabetes. 2023; 16(1): 07-09. https://revistasoched.cl/1_2023/01.html
- American Diabetes Association Professional Practice Committee; Summary of Revisions: Standards of Care in Diabetes-2024. Diabetes Care 1 January. 2024; 47(Suppl 1): S5-S10.
- American Diabetes Association. Nutrition Therapy Recommendations for the Management of Adults with Diabetes. Diabetes Care. 2014; 37(Suppl 1): S120-S143.
- American Diabetes Association Professional Practice Committee; 5. Facilitating Positive Health Behaviors and Well-being to Improve Health Outcomes: Standards of Care in Diabetes-2024. Diabetes Care .2024; 47 (Suppl 1): S77-S110.
- Food Sanitary Regulations, Ministry of Health. Updated 2021. Available at Available at https://quimica.uchile.cl/dam/jcr:b1088bf7-a761-4fdc-a128- 2e4869f7eecc/RSA-actualizado-febrero-21.pdf, last visited 09-24-2024.
- Quitral V, Arteaga J, Rivera M, Galleguillos J, Valdés I. Comparison of the content of sugars and non-caloric sweeteners in nectars and beverages before and after implementing Chilean law 20,606. Rev Chil Nourish. [cited 2022 Aug 29]. 2019; 46(3): 245-253.
- Corvalan C, Correa T, Reyes M, Paraje G. Impact of the Chilean labeling law on the food production sector. Rome, Italy: Food & Agriculture Organization of the United Nations (FAO); 2021-57-59.
- Sambra V, López-Arana S, Cáceres P, Abrigo K, Collinao J, Espinoza A, et al. Overuse of non-caloric sweeteners in foods and beverages in Chile: A threat to consumers’ free choice? Front Nutr. 2020; 7: 68.
- Martyn D, Darch M, Roberts A, Lee HY, Yaqiong Tian T, Kaburagi N, et al. Low-/No-Calorie Sweeteners: A Review of Global Intakes. Nutrients. 2018; 10(3): 23.
- Archibald AJ, Dolinsky VW, Azad MB. Early-life exposure to non-nutritive sweeteners and the developmental origins of childhood obesity: global evidence from human and rodent studies. Nutrients. 2018; 10: 194.
- World Health Organization. Use of non-sugar sweeteners: WHO guideline. Geneva: World Health Organization; 2023.
- Romo-Romo A, Almeda-Valdés P, Brito-Córdova GX, Gómez-Pérez FJ. Prevalence of non-nutritive sweeteners consumption in a population of patients with diabetes in Mexico. Gac Med Mex. 2017; 153(1): 61-74. Spanish. PMID: 28128808.
- Ilback NG, Alzin M, Jahrl S, Enghardt-Barbieri H, Busk L. Estimated intake of the artificial sweeteners acesulfame-K, aspartame, cyclamate, and saccharin in a group of Swedish diabetics. Food Addit Contam. 2003; 20: 99-114.
- Garnier-Sagne I, Leblanc JC, Verger P. Calculation of the intake of three intense sweeteners in young insulin-dependent diabetics. Food Chem Toxicol. 2001; 39: 745-749.
- Cullen M, Nolan J, Cullen M, Moloney M, Kearney J, Lambe J, Gibney MJ. Effect of high levels of intense sweetener intake in insulin dependent diabetics on the ratio of dietary sugar to fat: A case-control study. Eur J Clin Nutr. 2004; 58(10): 1336-1341.
- Dewinter L, Casteels K, Corthouts K, Van de Kerckhove K, Van der Vaerent K, Vanmeerbeeck K, et al. Dietary intake of non-nutritive sweeteners in type 1 diabetes mellitus children. Food Addit Contam Part A Chem Anal Control Expo Risk Assess. 2016; 33(1): 19-26.
- Hamilton V GE, Golusta C, Lera L, Cornejo V. Non-caloric sweeteners and daily acceptable intake in adults and children with normal weight and obesity from three different socioeconomic levels, and a diabetic group from Metropolitan Region. Rev Chil Nutr. 2013; 40: 123-128.
- Gibson, Rosalind S, Principles Of Nutritional Assessment (New York, 2005; online edn, Oxford Academic, 31 Oct. 2023), accessed 19 Jan. 2024.
- Food Health Regulations, article 146. Institute of Nutrition and Food Technology INTA. Available at: http://www.redsalud.gov.cl/portal/url/page/ minsalcl/g_proteccion/g_alimentos/reglamento_sanitario_alimentos.html
- Leth T, Jensens U, Fagt S, Andersen R. Estimated intake of intense sweeteners from non-alcoholic beverages in Denmark, 2005. Food Additives Contaminants. 2008; 25: 662-668.
- Debras C, Deschasaux-Tanguy M, Chazelas E, Sellem L, Druesne-Pecollo N, Esseddik Y, et al. Artificial Sweeteners and Risk of Type 2 Diabetes in the Prospective NutriNet-Santé Cohort. Diabetes Care. 2023; 46(9): 1681-1690.
- Miller PE, Perez V. Low-calorie sweeteners and body weight and composition: a meta-analysis of randomized controlled trials and prospective cohort studies. Am J Clin Nutr. 2014; 100(3): 765-777.
- Akturk H.K, Snell-Bergeon J, Karakus K.E, et al. Evaluation of the relationship between low-calorie sweetener consumption and quality of life measures in adults with type 1 diabetes. BMC Endocr Disord. 2023; 23: 147. https://doi.org/10.1186/s12902-023-01399-y
- Durán S, Quijada M, Silva L, Almonacid N, Berlanga M, Rodríguez M. Daily consumption levels of non-nutritive sweeteners in school-age children from the Valparaiso region. Rev Chil Nutr. 2011; 38(4): 444-449.
- Tennant DR. Estimation of exposures to non-nutritive sweeteners from consumption of tabletop sweetener products: A review. Food Addit Contam Part A Chem Anal Control Expo Risk Assess. 2019; 36(3): 359-365. doi: 10.1080/19440049.2019.1566784. Epub 2019 Feb 12. PMID: 30747598.
- Sylvetsky A, Rother K. Trends in the consumption of low-calorie sweeteners. Physiology & Behavior. 164 (Pt B). 2015; 446-450. doi: 10.1016/j.physbeh.2016.03.030.
- Holt R, DeVries JH, Hess-Fischl A, Hirsch I, Kirkman M, Klupa T, Ludwig B, Nørgaard K, Pettus J, Renard E, Skyler J, Snoek F, Weinstock R, Peters A. The Management of Type 1 Diabetes in Adults. A Consensus Report by the American Diabetes Association (ADA) and the European Association for the Study of Diabetes (EASD). Diabetes Care. 2021; 44 (11): 2589-2625. https://doi.org/10.2337/dci21-0043
- Lohner S, Kuellenberg de Gaudry D, Toews I, Ferenci T, Meerpohl JJ. Non-nutritive sweeteners for diabetes mellitus. Cochrane Database Syst Rev. 2020; 5(5): CD012885. doi: 10.1002/14651858.CD012885.pub2. PMID: 32449201; PMCID: PMC7387865.